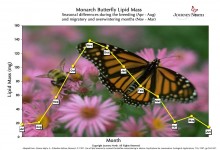
Featured Image Caption
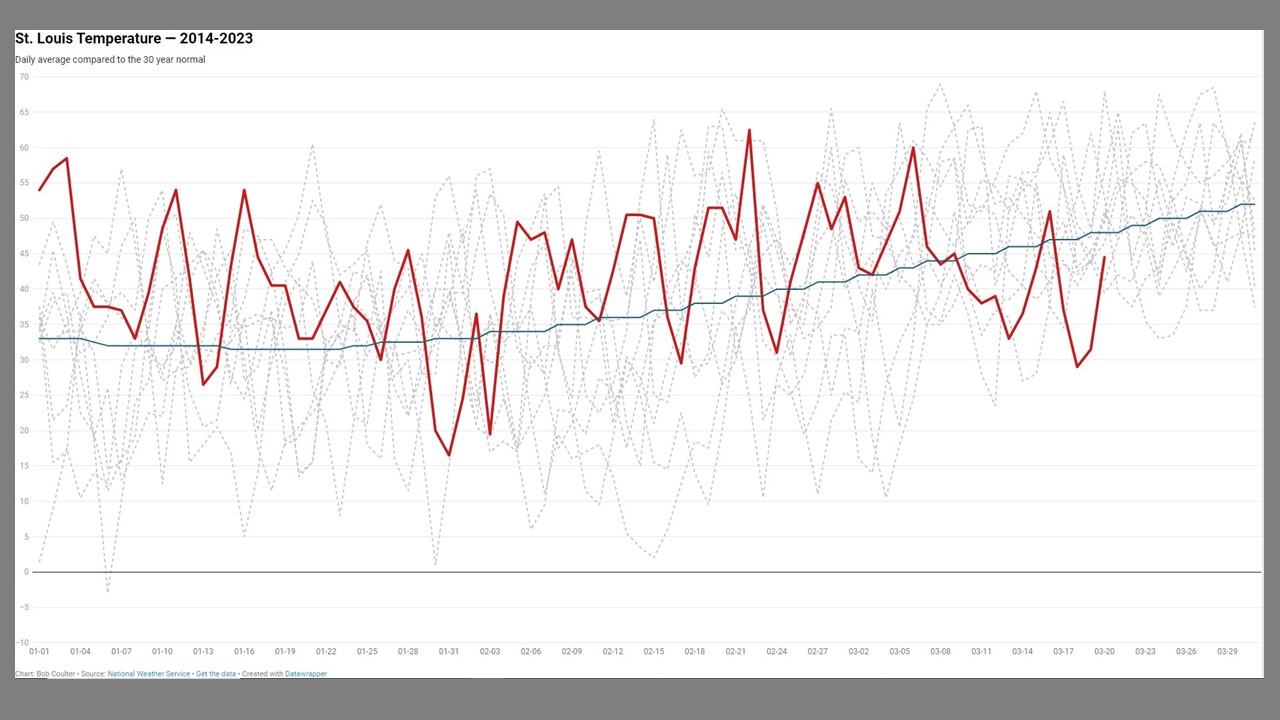
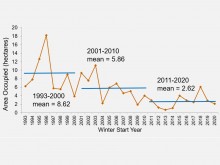
Graph #1 (Click to enlarge)
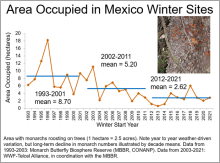
Featured Image Caption
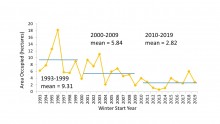
Monarch Population Winter Numbers
What do the graphs reveal about the sanctuaries monarchs select from year to year? Why is it valuable to have information from more than one year? What predictions could you make about the future based on these graphs?