New Jersey Study Shows Slowest Fall Migration in 14 Years
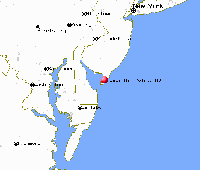
For the 14th year, monarchs are being counted every single day as they migrate through Cape May, New Jersey. This October 1st, after four weeks of counting, the average number of monarchs seen per hour of observation is only 7.41 butterflies.
Here are the data that have been collected since 1992 as of Week #4 each year:
Data courtesy of Dick Walton, Project Director, The Monarch Monitoring Project (Cape May Bird Observatory/New Jersey Audubon), Cape May, NJ.
Try This!
-
Make a chart of the migration rate each year. (Or print and analyze our chart above.)
-
Which year was the migration rate the highest? The lowest?
-
Write the years in order, from highest to lowest migration rate.
-
What is the average migration rate?
-
How does this year’s migration rate compare to the average?
National Math Standards
- Understand numbers, ways of representing numbers, relationships among numbers, and number systems.
- Create and use representations to organize, record, and communicate mathematical ideas.
- Select and use appropriate statistical methods to analyze data.


