Project
Organization and Timeline
Project Flow: Analyzing Data
Cathie Plaehn
5th grade
Tiffany Creek Elementary
Boyceville, Wisconsin
Teamwork & Solving the Mystery Class Mystery
 Attempting to locate the Mystery Classes
is one of the most integrated components of Journey North. Included are math,
when calculating the photo period; science, when connecting clues referring
to plants or animals; social studies, when given historical or geographic clues;
and reading to research any of the above information. As a teacher you will
need to remain flexible and learn with your students.
Attempting to locate the Mystery Classes
is one of the most integrated components of Journey North. Included are math,
when calculating the photo period; science, when connecting clues referring
to plants or animals; social studies, when given historical or geographic clues;
and reading to research any of the above information. As a teacher you will
need to remain flexible and learn with your students.
Practice Makes Perfect
Practicing to calculate photoperiods can begin at any point before February.
You will spark their curiosity if you begin practice before the winter
solstice, when they initially will see the least sunlight, and then
begin seeing the increase in daylength.
Finding Local Sunrise/Sunset Data
It is important from the beginning to find a consistent source for your local
sunrise and sunset data to use as a comparison. There is a variance between
TV channels and newspapers within a city, whichever you choose use the same
source throughout.
An excellent source for local sunrise and sunset data can be found from the
University of Michigan's website:
Working Together
 There are 10 Mystery Classes,
which lends itself to using small cooperative groups for this activity.
Generally, I use one of the classes as a model to demonstrate the
thinking processes for locating a class.
There are 10 Mystery Classes,
which lends itself to using small cooperative groups for this activity.
Generally, I use one of the classes as a model to demonstrate the
thinking processes for locating a class.
Every group will need a Datasheet as found on the Journey North website,
and a plan for organizing the informational clues that will be coming.
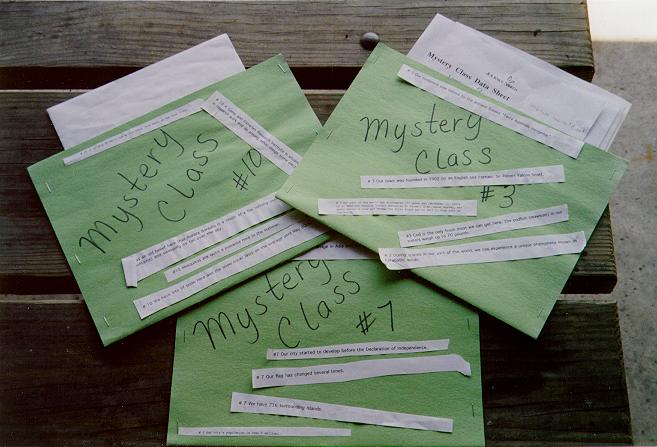
My students kept losing their data and clues from one week to the next until
I came up with this idea: I make folders for each Mystery
Class group and hang them on the bulletin board. The Datasheet is kept inside.
And when the clues start coming in March, I actually glue or staple them to
the outside of the folder so they don't get lost. Another helpful suggestion
is to use a large (3 x 3) classroom photoperiod wall graph using
butcher block paper to plot all classes, which is beneficial as you try to
locate classes in relationship to each other. (Click on Photos to enlarge).
 Now You're Ready for
the Data to Come
Now You're Ready for
the Data to Come
The first few weeks the students are given data to calculate the photoperiod
of each class. As a pattern emerges students are able to make their first prediction
--"is it in the northern or southern hemisphere?" This will become
evident as the amount of sunlight increases (northern) or decreases ( southern).
Students will also be able to predict whether their class is near the equator,
if the angle on their graph is small, or farther away, if the angle has a greater
slope. They will also see your own class in relationship to the Mystery Classes.
Narrowing the Search with Clues
Mid-March informational clues begin, which vary from historical
events to local plants vegetation. Because of the variety of clues,
the more resources your students are familiar with and you have available
the better. Encyclopedias, atlases, and almanacs are generally good
places to start. Encourage your students to use a variety of sources
including the internet and people.
As the information comes remind your students to build onto the information
they already have, they should not treat each clue as separate. They will begin
narrowing in on an area, then more specifically a city. Some will come easily
and some may never be precisely located. Encourage them to make the best prediction
they can, given the information they have.
Final predictions are submitted giving city, country, latitude and longitude.
There are many excellent CD-roms which can give the specific latitude and longitude
by inputting the city, as well as WWW sites.
If you have tips you'd like to share, please write to Journey North: jnorth@learner.org
© 1997 – 2025 Journey North. All rights reserved.