Explore Our New Visualization
Earlier this year, Journey North program coordinator, Nancy Sheehan, worked with the FieldScope/BSCS Science Learning team to bring data on milkweed, monarch, and hummingbird tracking and monitoring into a newly launched FieldScope project. Data from Journey North’s Hummingbird and Monarch & Milkweed Projects are now available from 1994–2020.
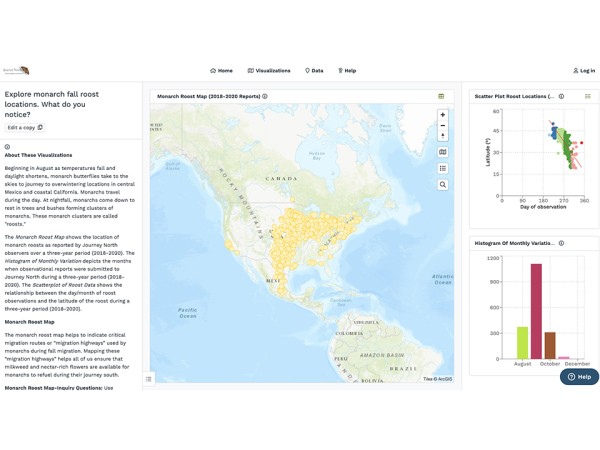
FieldScope is an online platform for citizen and community science projects with tools for visualizing and analyzing data. Educators can use rich educational materials on the FieldScope/BSCS Science Learning website. These materials, called Invitations to Inquiry, help educators guide middle and high school students as they learn to collect, visualize, and analyze data from community and citizen science projects. Invitations to Inquiry provide a structured inquiry experience to lead educators toward providing students with open-ended data inquiry experiences. Explore Journey North monarch fall roost data using FieldScope’s advanced mapping and graphing tools, and dig deeper into data in the context of meaningful science classroom lessons.
To kickstart this collaboration, Sheehan developed a new learning module to facilitate exploration of monarch fall roost data collected by Journey North volunteers from 2018 –2020. Sheehan and FieldScope program manager, Sean O’Connor, unveiled this visualization during a recent educator training workshop held in at the UW–Madison Arboretum. Journey North hopes to foster the use of authentic data within educational settings. From middle school classrooms to undergraduate studies, students can enhance their data literacy skills by analyzing and interpreting volunteer-collected data.
Explore the new visualization. What trends do you notice?