GIS and Monarch Migration Data
Marian University faculty and students
analyze Journey North data in GIS class
Marian University faculty and students
analyze Journey North data in GIS class
By Dr. Zach Sylvain
This past spring, I taught Geographic Information Systems (GIS) to primarily third- and fourth-year undergraduate students. Spatial thinking and analyses are important skills for students interested in careers in environmental science, and I also had students interested in public health and the social sciences who were excited to be able to look at how spatial relationships between data can provide greater insight into topics in their respective fields. Unlike many more traditional courses, however, GIS is highly dependent upon its software and as such is much more applied in its utility. This poses unique challenges for instruction and so I really wanted to focus on the hands-on side of things to help students gain an appreciation for and mastery of the subject material. When students graduate and go off to use these skills in their careers or further study, they’re going to be expected to be able to take real data (generally collected from the field, remotely, or sourced online) and use it to come up with some final product. I believe the best way to get comfortable with approaching novel problems like this is kind of “trial by fire”, where you pick a project and see if you can tackle it. My goal for the course was to have students gain familiarity with QGIS (an open source GIS software platform) so that they would be comfortable using it for novel data applications.
To this end, I assigned my GIS students a final project that would let them explore how GIS is used in a field they were interested in, what sorts of questions it was being used to answer, and then to come up with a small research question they could use existing data to answer on their own. For the first part of this, I had students search the literature to find, critique and present a paper of their choice to the class so that they could get a general idea about the applications of GIS tools to their future careers. Once they had a general idea about what was possible, I tasked them with coming up with a small question for which they would likely be able to find existing data online (or be able to easily collect data), and put together an outline of what data they would need, where they could source it from, and what approaches they would need to employ to wrangle the data into a final product. I was less concerned with the specifics of the project so long as it was a topic they were interested in; what I really wanted was for them to have something that would motivate them to turn raw (possibly messy) data into spatial visualizations and an answer to their question. This would give them a chance to wrestle with all the peculiarities of real data as they used QGIS to bring the hidden patterns and relationships into view. Students came up with a great selection of projects, including the impact of racial and economic demographics on opioid deaths in Indiana, access to public parks as an issue in environmental justice, habitat use by box turtles in Marian University’s EcoLab, and how climate change may be influencing the phenology of monarch butterflies. For this latter project, my student Sarah was eager to use the citizen science data collected and curated by the Journey North project.
By Sarah Downing
As a college freshman at Marian University, I participated in Journey North’s citizen science project designed to help track Monarch Butterfly migration patterns; that everyday citizens were able to make such meaningful contributions to our understanding of these butterflies was incredible to me at the time. When Dr. Sylvain tasked us with creating a research project using publicly available data during my senior year, my mind immediately went to my previous experience with Monarch Butterfly migration tracking. After a brief inquiry, I was thrilled when Nancy Sheehan, Journey North program coordinator, provided fifteen years’ worth of data to make this project a reality.
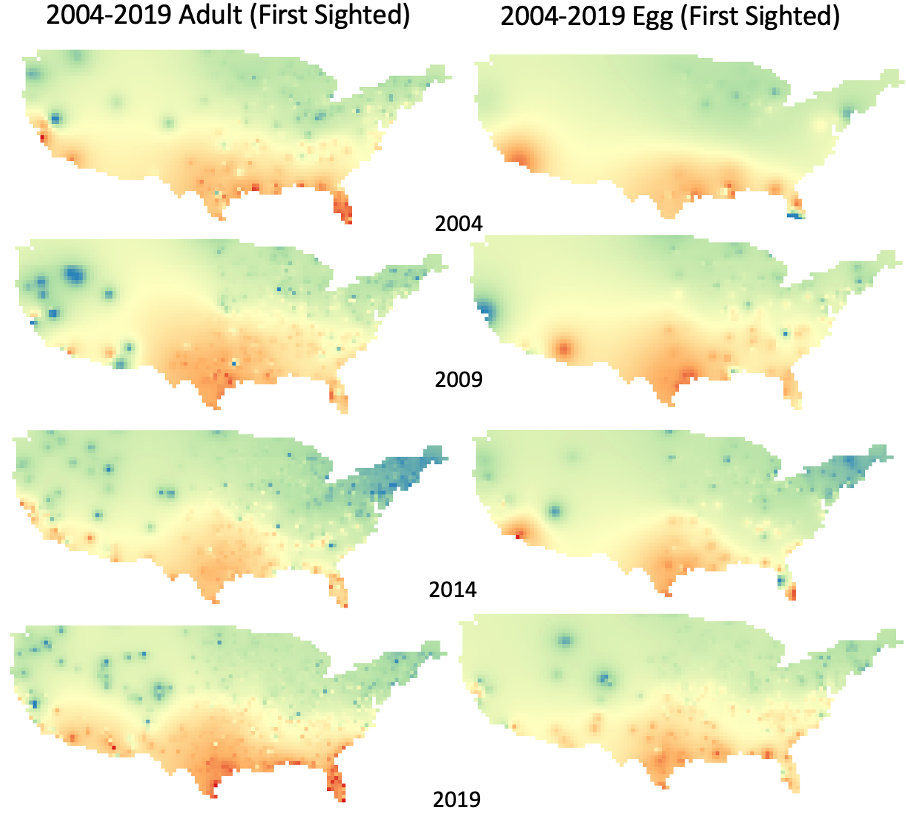
My goal was to map the first reported sightings of milkweed, adult Monarchs, and Monarch eggs across the US from 2004 to 2019, see if there were any noticeable changes in the timing, and compare these data with predicted climate change patterns. After looking over the data, Dr. Sylvain and I realized there were some necessary conversions to make the data compatible with QGIS. First, we applied a filter to separate each of the three topics to their own spreadsheets to make more organized and smaller files for GIS to analyze later on. While QGIS was able to immediately import and plot the data points from the spreadsheet, the date format used for the data prevented us from creating the heatmaps needed for yearly comparisons. I feel this was one of our larger stumbling blocks because we needed to think about how to fix this; we eventually switched the calendar date to a Julian Calendar system (1/18/2004 would instead be written as 04018). This then allowed us to add additional columns to the spreadsheet to separate the year and the day into numerical values (one row showed the year 04 as a numeric value, the second was the value 018 denoting the 18th day of the year). Once this was done, we had created a very organized spreadsheet that was easily transferred to a CSV file and imported into GIS to make all the necessary maps. These conversions were instrumental in allowing us to use GIS to assign coordinate values to the data for each respective year, while also saving time because one variable’s data from all years could stay in one CSV file and be filtered within QGIS instead of needing to create individual files for each year for a single topic.
In the end, I created thirty-five heat maps spanning fifteen years of data related to Monarch Butterflies and their larvae’s main food source. The data seems to suggest that both Monarch Adults and Eggs are being spotted in the Southern United States earlier over the span of 2004-2019. Milkweed data suggests that plants are emerging sooner than normal in several regions of the U.S, especially for the Midwest. Milkweed’s change in growing season is consistent to what we would predict in global warming scenarios. Monarch adults have an optimal window of opportunity to lay their eggs on a milkweed plant for the highest rate of larvae success. It would seem that Monarchs are traveling North from Mexico faster in order to find these milkweed plants and meet this window of opportunity.
This project was my fifth undergraduate research project, and certainly my best in terms of ease of data analysis. My past research experience taught me the importance of considering my analysis methods before gathering data to ensure I record all the pertinent information consistently. A lot of undergraduate students are often excited to jump right into data gathering, and then struggle with deciding what to do with their data once it is gathered. Journey North’s detailed data enabled me to gather all the information I needed to and display results that can help both citizens and scientists alike understand the changes we are seeing in one of America’s most beloved butterflies. Little did I know that my first volunteer - experience four years ago would spark my imagination for one of the best research projects I have worked on in my undergraduate studies. Thank you, Nancy Sheehan and Journey North, for your help with this project!
Dr. Zach Sylvain is an assistant professor of Biology at Marian University, where he teaches courses on and conducts research in Ecology and Environmental Science.
Sarah Downing is a 2021 graduate of Marian University in Indianapolis, where she earned a B.Sc. in Biology. She is currently a restoration technician for Cardno, an environmental consulting company
The Nina Mason Pulliam EcoLab is committed to education about the environment through interaction with the environment. The NMP EcoLab property is a 75-acre natural area on the Marian University campus where environmental restoration began 100 years ago with esteemed landscape architect, Jens Jensen and continues today with Marian students, K-12 school groups, and the general public. Marian University students and faculty use the NMP EcoLab in their classes as a site for hands-on experiences in the natural environment. It also provides a great location for undergraduate research and for internships in ecological restoration and environmental education.