Phenology + Climate = Great Learning
The Early Days
I was one of the early participants in the Journey North Tulip Garden project, using it with my 3rd and 4th graders back in 1997 and 1998. While I’ve remained a fan, I wasn’t able to return to the project until this year when I started a new effort to mentor upper elementary and middle school teachers in place-based learning that is rich in data and modeling. One strand of this work has been to explore ways local weather and climate data can extend students’ understanding of nature. While our efforts are very preliminary at this point, I hope the ideas shared here spark ideas of your own.
Expanding Perspectives
I am currently supporting teachers at 4 area schools with their Journey North Tulip Test Garden projects. The larger project I’m leading — reworking an old What’s it Like Where You Live? curriculum developed by the Missouri Botanical Garden many years ago — starts with engaging students in their local ecosystems and using that as the basis for comparing the distant, whether that be spatially distant (i.e. prairies and woods here in St. Louis compared with the desert in southern Arizona), or distant in time (looking at projected climate change in the region and what its ecological impact might be). To avoid having the data and models become too abstract, I want to anchor them in students’ lived experience. For this, putting numbers on the weather they’ve lived with and linking it to both the longer-term climate data and their tulip gardens has proven to be a great resource and a catalyst for thinking about the world outside.
Extending Field Investigations
At a basic level, I found that working with teachers and students on their garden site selection sparked great thinking about microhabitats around the schoolyard and the possible impact variations in temperature and moisture levels might have on their tulips’ growth. Along with this, we thought quite a bit about sun and shadows and the changes that will come as trees leaf out.
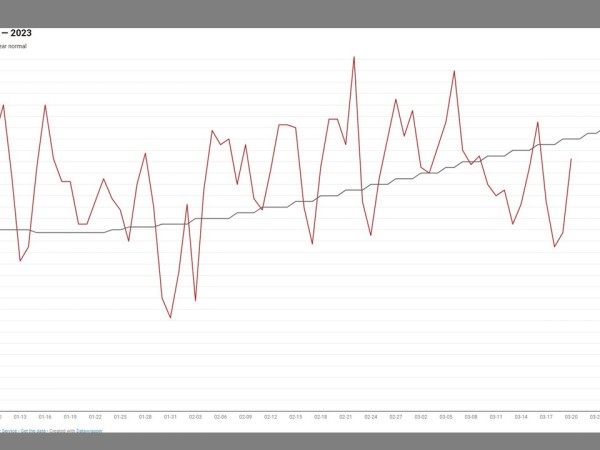
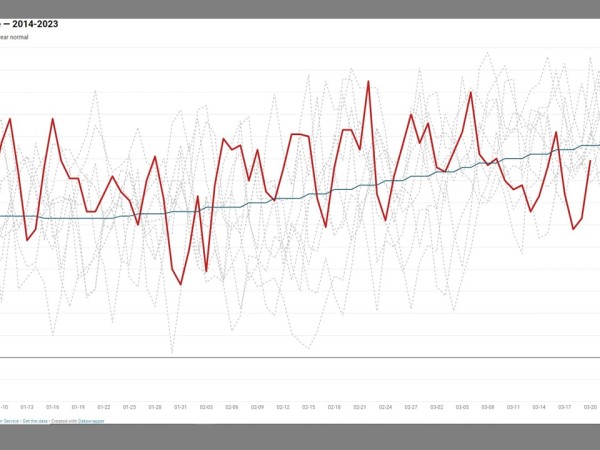
Extending the field investigations, a second venture, graphing local weather and climate data, has helped raise students' sights beyond the immediate space of their schoolyard. For this venture, I’ve explored two formats (both shared here) to engage students in simpler and more complex representations of this year’s weather compared to what would be “normal” in a St. Louis spring. One — perhaps best for younger students — simply compares the daily average temperature with the 30-year normal (itself a rich topic for discussion!). The other graph offers the same data as well as muted colors for previous years going back to 2014. If you hover your cursor over one of these lines, that year is highlighted. A group of 7th graders did a great job working with the complex graph and then using the web links at the bottom of the graph to access the full data set for further analysis. For example, one particularly creative student learned how to navigate the weather.gov interface and looked up the weather on the day his dad was born — just the kind of self-driven extension we want from students.
As you can see from the graphs, up until recently we’ve had a warm late winter and early spring season. Students drew from what they know about plant growth to share their belief that conditions were pretty good for the tulips’ emergence and blooming. While we don’t have multiple years of data at each site to compare yet, the teachers and I are pleased with the ways data enhanced classroom discussions.
We’re looking forward to continuing so they can compare next year’s tulip and weather data with what they found this year. If it’s a cooler year, will the emergence and blooming be delayed? Stay tuned….
--Bob Coulter
Bob Coulter is the director of the Litzsinger Road Ecology Center, a field site managed by the Missouri Botanical Garden. Previously he was an award-winning elementary grade teacher.